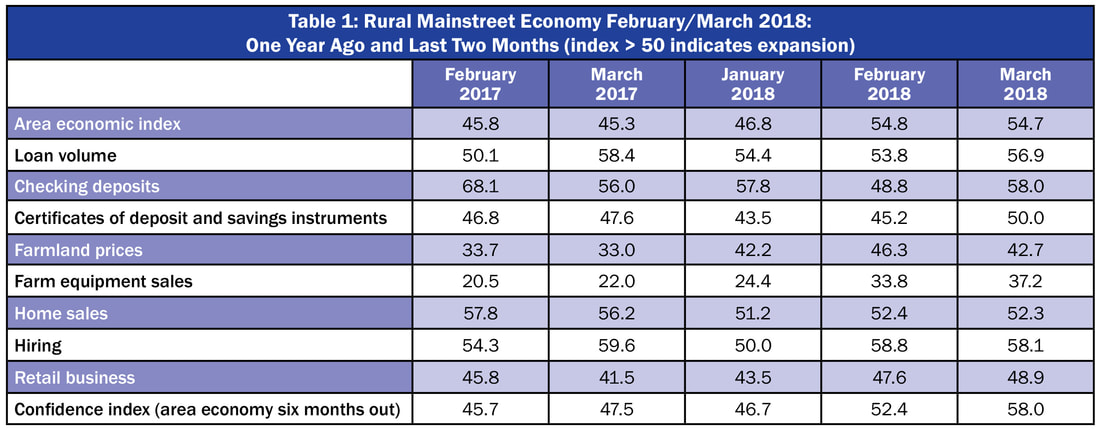
- For a second straight month the overall index rose above growth neutral.
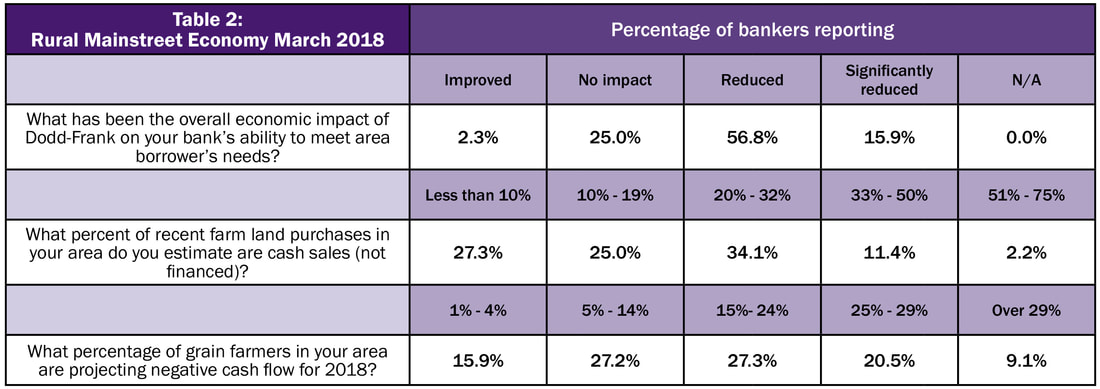
- Approximately 16.8 percent of grain farmers are expected to suffer negative cash flow for 2018. This is down slightly from 12 months earlier.
- The percent of farmland purchases for cash (not financed) declined from 23 percent to 20 percent over the past 12 months according to bankers.
Overall: The overall index dipped slightly to a solid 54.7 from 54.8 in February. The index ranges between 0 and 100 with 50.0 representing growth neutral.
“Surveys over the past several months indicate that the Rural Mainstreet economy is trending upward with improving, but slow economic growth. However, weak agriculture commodity prices continue to weigh on the rural economy,” said Ernie Goss, Jack A. MacAllister Chair in Regional Economics at Creighton University’s Heider College of Business.
Jim Eckert, president of Anchor State Bank in Anchor, Illinois, reported, “Recent commodity price increases have helped the mood of our farmers. Our area is somewhat dry and good spring rains will be essential for a good 2018 crop.”
Farming and Ranching: The farmland and ranchland-price index for March dropped to 42.7 from February’s 46.3. This is the 52nd straight month the index has fallen below growth neutral 50.0.
The February farm equipment-sales index jumped to 37.2 from February’s 33.8. This marks the 55th consecutive month the reading has moved below growth neutral, 50.0.
Bankers project that 16.8 percent of grain farmers in the region will experience negative cash flow for 2018. This is down slightly from 12 months earlier when bank CEOs estimated that 17.0 percent of grain farmers would suffer from cash costs exceeding case revenues.
According to Fritz Kuhlmeier, CEO of Citizens State Bank in Lena, Illinois, “Many borrowers in the Ag sector continue to erode working cash with negative cash flow projections.”
Banking: Borrowing by farmers expanded for March as the loan-volume index rose to 56.8 from 53.8 in February. The checking-deposit index climbed to 58.0 from February’s 48.8, while the index for certificates of deposit and other savings instruments advanced to 50.0 from 45.2 in February.
Bank CEOs were asked how 2010’s Dodd-Frank Bill has affected their banks’ ability to meet borrowing needs of area farmers. Approximately 72.7 reported that the bill has limited their banks’ ability to meet area farmers’ borrowing needs.
On the other hand, several bankers brought out some of the positives of the Dodd-Frank bill. For example, Jeffrey Gerhart, chairman of the Bank of Newman Grove, Newman Grove, Nebraska identified two positives from the legislation. “Dodd/Frank raised FDIC coverage from $100,000 to $250,000 which has helped our deposit growth. FDIC assessments were significantly lowered for community banks while FDIC assessments were increased for large banks who had been exempt from paying their fair share.”
Hiring: The employment gauge declined to a still healthy 58.1 from February’s 58.8 and January’s 50.0. The Rural Mainstreet economy is now experiencing positive year-over-year job growth.
Confidence: The confidence index, which reflects expectations for the economy six months out, jumped to 58.0 from February’s 52.4 indicating rising economic optimism among bankers. This is the highest reading for the economic confidence number since June 2013. “However, an unresolved North America Free Trade Agreement and relatively weak agriculture commodity prices continue to be a concern,” said Goss.
Pete Haddeland, CEO of the First National Bank in Mahnomen, Minnesota indicated that rural bankers would be keeping a close eye on NAFTA negotiations and their impact on ag commodity prices.
Home and Retail Sales: The home-sales index moved slightly lower for the Rural Mainstreet economy in March falling to 52.3 from February’s 52.4. The March retail-sales index improved to a weak 48.9 from 47.6 in February. Much like their urban counterparts, Rural Mainstreet retailers continue to experience weak sales.
This survey represents an early snapshot of the economy of rural agriculturally and energy-dependent portions of the nation. The Rural Mainstreet Index (RMI) is a unique index covering 10 regional states, focusing on approximately 200 rural communities with an average population of 1,300. It gives the most current real-time analysis of the rural economy. Goss and Bill McQuillan, former chairman of the Independent Community Banks of America, created the monthly economic survey in 2005.
| Colorado: Colorado’s Rural Mainstreet Index (RMI) increased to 62.0 from 59.6 in February. The farmland and ranchland-price index fell to 44.9 from February’s 47.7. Colorado’s hiring index for March climbed to 73.0 from February’s 68.6. Illinois: The March RMI for Illinois climbed to 58.4 from 54.4 in February. The farmland-price index rose to 47.3 from 46.1 in February. The state’s new-hiring index advanced to 65.8 from last month’s 58.1. Iowa: The March RMI for Iowa fell to 52.8 from 55.3 in February. Iowa’s farmland-price index for March declined to 42.7 from February’s 46.4. Iowa’s new-hiring index for March dipped to 58.5 from February’s 60.0. Kansas: The Kansas RMI for March jumped to 55.7 from February’s 51.1. The state’s farmland-price index rose to 45.8 from 45.1 in February. The new-hiring index for Kansas climbed to 60.5 from February’s 51.5. Minnesota: The March RMI for Minnesota expanded to 54.9 from February’s 52.9. Minnesota’s farmland-price index decreased to 42.7 from 45.1 in February. The new-hiring index for the state climbed to 58.8 from February’s 51.4. | Missouri: The March RMI for Missouri declined to 59.0 from 59.6 in February. The farmland-price index expanded to 44.0 from 42.3 in February. Missouri’s new-hiring index declined to 54.1 from 68.5 in February. Nebraska: The Nebraska RMI for March fell to 52.3 from February’s 54.3. The state’s farmland-price index sank to 42.6 from last month’s 46.1. Nebraska’s new-hiring index fell to a still solid 57.8 from 57.9 in February. North Dakota: The North Dakota RMI for March sank to 51.4 from February’s 57.9. The state’s farmland-price index moved lower to 41.7 from 47.2 in February. North Dakota’s new-hiring index fell to 51.8 to 65.1 in February. South Dakota: The March RMI for South Dakota moved above growth neutral to a solid 54.4 from February’s 48.2. The state’s farmland-price index climbed to 42.6 from February’s 40.0. South Dakota's new-hiring index expanded to 55.1 from 45.8 in February. Wyoming: The March RMI for Wyoming rose to 55.5 from February’s 52.3. The March farmland and ranchland-price index slumped to 42.9 from 48.9 in February. Wyoming’s new-hiring index slipped to 53.8 from February’s 53.9. |
(Click each table to view larger.)


 RSS Feed